Today most of you are working on building the cloud infrastructure for an organization and then deploying multi-tier microservices and applications, and so on. This is great when you see an application or website running on your Phone or PC browsers, right? Having said that, what if when the browser doesn’t open the site or load it very slow?
Certainly, it needs attention for admins. So, it is equally important to monitor your applications and set alerts in case anything goes wrong.
One such open-source tool which performs analysis of logs, errors from various sources and centrally manages the monitoring of all of it & notifying admins is GRAFANA 📊 but the combination of Prometheus and Grafana is becoming a more and more common monitoring stack used by DevOps teams for storing and visualizing time series data. Prometheus acts as the storage backend and Grafana as the interface for analysis and visualization.
In this tutorial, you will learn how to build a monitoring Dashboard with Grafana and Prometheus.
Table of Content
- What is Grafana?
- How to Install Grafana on Ubuntu Machine
- How to Log in to Grafana?
- What is Prometheus?
- How to Install Prometheus?
- What is node exporter ?
- How to install node exporter?
- Configure a Prometheus Monitoring Server with a Grafana Dashboard
What is Grafana?
Grafana is an open-source tool that allows you to query, visualize, analyze and alert on metrics and logs no matter where they are stored. Grafana comes bundled with rich support for many time-series databases like Graphite, Prometheus, Elasticsearch, Influx DB. It also supports cloud monitoring vendors such as Amazon cloud watch, Microsoft Azure, SQL Db’s and Postgres, and MySQL. It is written in Go Language.
How to Install Grafana on Ubuntu Machine
In the previous section, you learned what Grafana is and what it can do for you. Enough Theory, let’s dive into installing Grafana on Ubuntu Machine?
- Firstly download the Grafana GPG Key. Adding the GPG key to your apt installation’s list of trusted key allows you to download and verify GPG Signed Packages.
wget -q -O - https://packages.grafana.com/gpg.key | sudo apt-key add - - Next, add the Grafana repository to your APT Sources.
sudo add-apt-repository "deb https://packages.grafana.com/oss/deb stable main"- Refresh your APT Cache to update your package list by running the below command.
sudo apt update- Now, Install Grafana package by running apt install command.
sudo apt install grafana- Start the Grafana server and verify the service status by using systemctl command.
sudo systemctl start grafana-server
How to Log in to Grafana?
Now that you have Grafana installed on your ubuntu machine. Let’s learn how you can access the Grafana console.
- To login to grafana open your favorite browser and navigate to localhost:3000 or If grafana is installed on your EC2 instance type navigate to.
<ec2_instance_ip_address>:3000- Next, enter email/username as admin , similarly password as admin and finally click on login which will take you to Grafana console.

What is Prometheus?
Prometheus is a powerful, open-source monitoring system that collects real-time metrics from services and stores them in memory and local disk in its own custom and efficient format [time-series database]. It is also used for alerting.
Time-series database contains a set of key-value pairs called labels. It is written in Go Language and executes powerful queries using Flexible query language. Prometheus provides great visualization using its own built-in expression browser and works well with Grafana dashboards and alert notifications.
There are dozens of client libraries and integrations available for Prometheus.
For example:

# Notation of time series
<metric name> {<label name>=<label value>,.....}
# Example
node_boot_time {instance="localhost:9000",job="node_exporter"}

How does Prometheus Work
Prometheus collects metrics from monitored targets by scraping metrics HTTP Endpoint using the Prometheus configuration file. A single Prometheus server is able to ingest up to one million samples per second.

- The Prometheus configuration file is stored in YAML format and by default it looks like.
# my global config
global:
  scrape_interval: 15s
  evaluation_interval: 15s

# To scrape metrics from prometheus itself add the below block of code.

scrape_configs:
  - job_name: 'prometheus'              # Prometheus will scrape
    scrape_interval: 5s
    static_configs:
      - targets: ['localhost:9090']

  - job_name: 'node_exporter_metrics'  # we are including Node Expoter
    scrape_interval: 5s
    static_configs:
      - targets: ['localhost:9100']
Prometheus Architecture
Prometheus server continuously pulls metrics from jobs or apps but at times it is not able to pull the metrics due to servers not reachable due to NAT or firewall and in that case, it uses Pushgateway.
Pushgateway is used as an intermediary service. You can also query the Prometheus server using the PromQL and can visualize the data in its own Web UI and the Grafana Dashboard.

How to Install Prometheus on an Ubuntu machine?
Installing Prometheus is a little tricky, so make sure to perform the steps carefully and don’t miss any steps, but the steps mentioned in this article will allow you to install Prometheus more easily. Let’s install Prometheus.
MacOS, Windows, Linux and some Unix distributions are supported.
- First thing you would need is to add users that will be used to set and manage prometheus and other for node_exporter
sudo useradd --no-create-home --shell /bin/false prometheus
sudo useradd --no-create-home --shell /bin/false node_exporter- Create two directories that will be used by Prometheus later.
sudo mkdir /etc/prometheus       # Some libraries will be copied in this directory
sudo mkdir /var/lib/prometheus # logs will be stored here- Next, set user and group permissions on newly created directories in previous step.
sudo chown prometheus:prometheus /etc/prometheus
sudo chown prometheus:prometheus /var/lib/prometheus- Next, download Prometheus and generate checksum in the home directory.
cd ~
curl -LO https://github.com/prometheus/prometheus/releases/download/v2.0.0/prometheus-2.0.0.linux-amd64.tar.gz
sha256sum prometheus-2.0.0.linux-amd64.tar.gz- Unpack the downloaded archive and copy to /usr/local/bin so that it can run from this location.
tar xvf prometheus-2.0.0.linux-amd64.tar.gz- After you unpack the extraction of prometheus it will generate two binaries in the directory i.e prometheus and promtool
sudo cp prometheus-2.0.0.linux-amd64/prometheus /usr/local/bin/
sudo cp prometheus-2.0.0.linux-amd64/promtool /usr/local/bin/- Again set the user and group permissions on copied directories.
sudo chown prometheus:prometheus /usr/local/bin/prometheus
sudo chown prometheus:prometheus /usr/local/bin/promtool- Copy both the files consoles and console_libraries under /etc directory (consoles and console_libraries contains the web interface, configuration files examples and the license)
sudo cp -r prometheus-2.0.0.linux-amd64/consoles /etc/prometheus
sudo cp -r prometheus-2.0.0.linux-amd64/console_libraries /etc/prometheus- Set user and group permissions on copied directories
sudo chown -R prometheus:prometheus /etc/prometheus/consoles
sudo chown -R prometheus:prometheus /etc/prometheus/console_libraries- Remove the leftover files from your home directory as they are no longer needed.
rm -rf prometheus-2.0.0.linux-amd64.tar.gz prometheus-2.0.0.linux-amd64- Now update the config file of the prometheus to scrape metrics from prometheus itself using the below configuration.
sudo vi /etc/prometheus/prometheus.ymlConfiguration can be changed just by using kill -SIGHUP <pid> command and to update the parameters you will need to restart the prometheus
global:
  scrape_interval: 15s # Setting the scrape time
  evaluation_interval: 15s  # Evaluating rules

scrape_configs:
  - job_name: 'prometheus'
    scrape_interval: 5s
    static_configs:
- targets: ['localhost:9090'] # To Scrape metrics from prometheus- Now edit the permission of config file
sudo chown prometheus:prometheus /etc/prometheus/prometheus.yml- Now you are set with all files and permissions, it’s time to Start the Prometheus by running the command below command.
sudo -u prometheus /usr/local/bin/prometheus --config.file /etc/prometheus/prometheus.yml \
--storage.tsdb.path /var/lib/prometheus/ \
--web.console.templates=/etc/prometheus/consoles \
--web.console.libraries=/etc/prometheus/console_libraries
- Verify if Prometheus is up and running by operning your favorite browser and navigating to <IP-address>:9090

Prometheus supports libraries such as Go, Java, scala , Python and Ruby. Prometheus supports four different metrics such as Counter, Gauge, Histogram and summary.
- To install Prometheus using Python client Library by running below command.
pip install prometheus_clientWhat is Node exporter ?
Prometheus has the capability to collect metrics, but it can extend its capabilities by adding Node Exporter. Node exporter can collect system information such as CPU, Disk, and memory utilization of the node.
For Windows machine there is a WMI exporter
How to install node exporter?
Earlier in the previous quick section about node exporters, you learned that node exporters can collect various system information, but it needs to be installed before it collects. Let’s learn how to install it.
- Download the latest version of Node Exporter and unpack the achieve
wget https://github.com/prometheus/node_exporter/releases/download/v0.16.0/node_exporter-0.16.0.linux-amd64.tar.gz
tar xvf node_exporter-0.16.0.linux-amd64.tar.gz- Copy the binary file to the executable path and set the ownership to the user.
sudo cp node_exporter-0.16.0.linux-amd64/node_exporter /usr/local/binsudo chown node_exporter:node_exporter /usr/local/bin/node_exporter- Create Node exporter service
sudo vi /etc/systemd/system/node_exporter.service- Create Node exporter service
[Unit]
Description=Node Exporter
Wants=network-online.target
After=network-online.target

[Service]
User=node_exporter
Group=node_exporter
Type=simple
ExecStart=/usr/local/bin/node_exporter

[Install]
WantedBy=multi-user.target
- . Reload Systemd to use the newly defined service:
sudo systemctl daemon-reload- Run Node Exporter by typing the following command:
sudo systemctl start node_exporter
sudo systemctl enable node_exporter
- Verify the node exporter by opening your favorite browser and navigating to the <IP-address:9100>

Configuring Prometheus within Grafana Dashboard
- To configure Prometheus within Grafana make sure to have installed Prometheus, Grafana, and Node exporter.
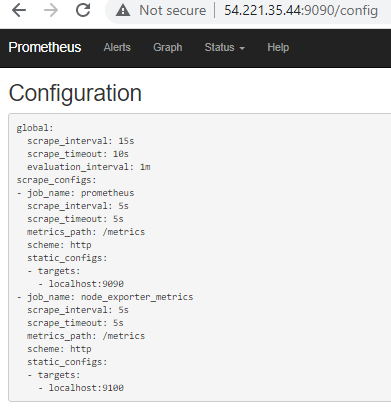
- Now, change the Prometheus configuration by including the node exporter in /etc/prometheus/prometheus.yml file.
global:
  scrape_interval: 15s

scrape_configs:
  - job_name: 'prometheus'              # Prometheus will scrape
    scrape_interval: 5s
    static_configs:
      - targets: ['localhost:9090']

  - job_name: 'node_exporter_metrics'  # we are including Node Expoter
    scrape_interval: 5s
    static_configs:
      - targets: ['localhost:9100']
- Now, again start Prometheus by running the command below
sudo -u prometheus /usr/local/bin/prometheus --config.file /etc/prometheus/prometheus.yml --storage.tsdb.path /var/lib/prometheus/ --web.console.templates=/etc/prometheus/consoles --web.console.libraries=/etc/prometheus/console_libraries- Verify by navigating to <http://public_address:9090> and check Prometheus.

- Now login to Grafana Dashboard <http://public_address:3000> by using admin as username and password and add a data source as Prometheus and then provide HTTP URL as http://localhost:9090

- Now you are connected to Prometheus , it will begin collecting data such as CPU, memory utilization.

Great, now we can see Grafana Dashboard shows us the required data visualization that Prometheus node exporter collected.
Conclusion
In this tutorial, we were able to Install all components such as Prometheus, Grafana, Node exporter and configured a Prometheus server with node exporter data collectors that are scraped by our Prometheus server, which provides the data to build Dashboards with Grafana.
So, which applications are you planning to monitor using Grafana and Prometheus?
