Install ELK Stack on Ubuntu: Elasticsearch, Logstash, and Kibana Dashboard.

If you are looking to quickly install ELK Stack, previously known as Elastic stack, then you have come to the right place.

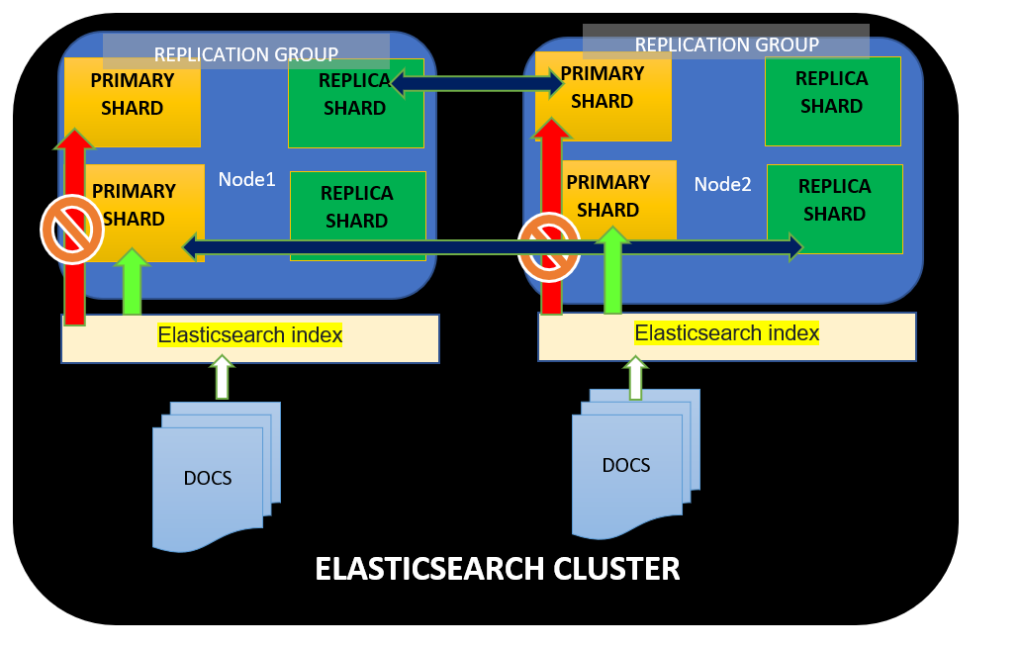
ELK Stack contains mainly four components, i.e., Elasticsearch, Logstash, Kibana Dashboard, Filebeat, and Metricbeat. Combing all these components, it is easier to store, search, analyze, and visualize logs generated from any source in any format.

In this tutorial, you will learn how to install ELK Stack, Elasticsearch, install Logstash, and install Kibana Dashboard on the Ubuntu machine.

Let’s dive in quickly.

Join 64 other subscribers

Table of Content

  1. Prerequisites
  2. How to Install Elasticsearch on ubuntu
  3. Configuring Elasticsearch on Ubuntu Machine
  4. How to Install Kibana on ubuntu
  5. Viewing Kibana Dashboard on Ubuntu Machine
  6. Verify the Kibana Dashboard
  7. How to Install Logstash
  8. Configuring Logstash with Filebeat
  9. Installing and Configuring Filebeat
  10. Installing and Configuring Metricbeat
  11. Verifying the ELK Stack in the Kibana Dashboard
  12. Conclusion
ELK Stack architecture

Prerequisites

  • Ubuntu machine preferably 18.04 version + , if you don’t have any machine you can create a ec2 instance on AWS account
  • Recommended to have 4GB RAM, at least 5GB of drive space.
  • Apache installed on the Ubuntu machine that works as a web server and proxy server.

You may incur a small charge for creating an EC2 instance on Amazon Managed Web Service.

How to Install Elasticsearch on ubuntu

Let’s kick off this tutorial by first installing the first component’s ELK stack that is Elasticsearch, but before you install Elasticsearch, you need to have java installed on the machine.

  • Login to Ubuntu machine using your favorite SSH client.
  • First, update your existing list of packages by running the below command.
sudo apt update
  • Now, install java using the apt install command as shown below.
# Installing Java Version: Java SE 11 (LTS)
sudo apt install default-jdk  
Installing Java
Installing Java
  • Next, verify the java version on your machine. As you can see below Java has been succesfully installed on ubuntu machine.
java -version               # To check the Installed Java Version
To check the Installed Java Version
  • Further add the GPG key for the official Elastic repository to your system. This key builds the trust of your machine with Elastic official repository and enable access to all the open-source software in the ELK stack.
wget -qO - https://artifacts.elastic.co/GPG-KEY-elasticsearch | sudo apt-key add -
Adding the GPG key for the official Elastic repository to your system
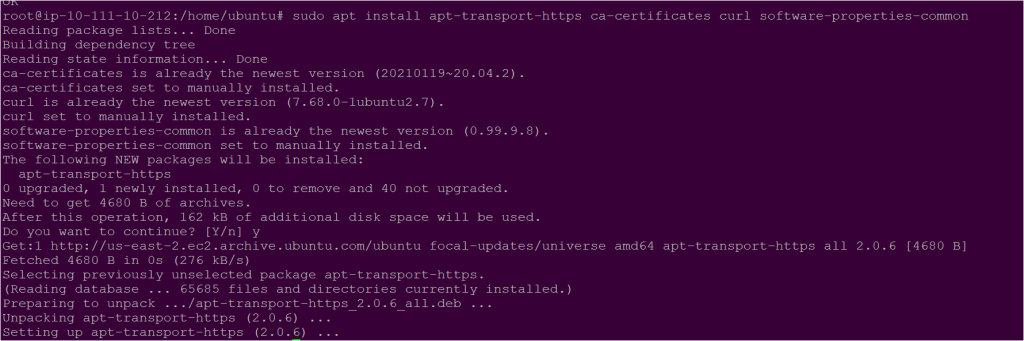
  • Install below prerequisites softwares so that apt uses packages over https protocol. The apt transport software allow your machine to connect with external respositories to connect over HTTPS or HTTP over TLS.
sudo apt install apt-transport-https ca-certificates curl software-properties-common
Installing softwares
Installing software
  • Now, add the Elastic repository to APT sources so that you can install all the required ELK package.
echo "deb https://artifacts.elastic.co/packages/7.x/apt stable main" | sudo tee –a /etc/apt/sources.list.d/elastic-7.x.list
  • Next, update the system using the following commands.
sudo apt update
  • Now its time to Install Elasticsearch with the following command:
sudo apt-get install elasticsearch
Install Elasticsearch

Configuring Elasticsearch on Ubuntu Machine

Now that you have successfully installed Elasticsearch on your ubuntu machine, it is important to configure the hostname and the port in the Elasticsearch configuration file. Let’s do it.

  • Open the Elasticsearch configuration file with below command and uncomment the network.host, http.port parameter.
vi /etc/elasticsearch/elasticsearch.yml
 uncomment the network.host, http.port parameter.
Uncomment the network. Host, http. Port parameter.
  • In the Elasticsearch configuration file update the discovery.type as below.
update the discovery.type
Update the discovery.type
  • Now, start and enable the Elasticsearch service on the ubuntu machine using below commands.
sudo systemctl enable elasticsearch.service
sudo systemctl start elasticsearch.service
start and enable the Elasticsearch service
 Checking the Elasticsearch service status
Checking the Elasticsearch service status
  • Finally, verify the Elasticsearch installtion by running the curl command on your machine on port 9200.
curl http://127.0.0.1:9200
Verify the Elasticsearch service

How to Install Kibana on ubuntu

Now that you have successfully installed Elasticsearch and configured it. The next component you need to install in the ELK stack is Kibana and view the kibana dashboard. Let’s install Kibana.

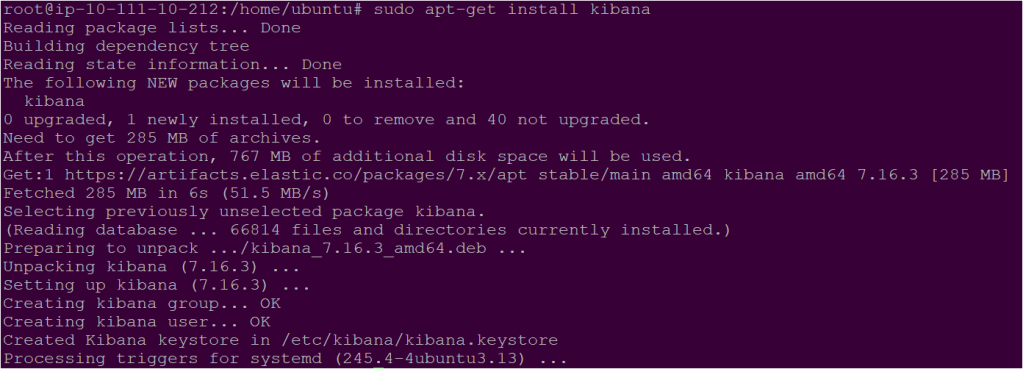
  • Installing kibana is simple and you need to run a single command as shown below.
sudo apt-get install kibana
Installing kibana
Installing kibana

Join 64 other subscribers
  • Now Kibana is installed succesfully. You will need to make changes in configuration file of Kibana as you did earlier for elasticsearch. To make the configuration changes open the kibana.yml configuration file and uncomment the following lines:
server.port: 5601
server.host: "localhost"
elasticsearch.hosts: ["http://localhost:9200"]
uncomment the kibana port, URL and elasticsearch host
uncomment the kibana port, URL, and elasticsearch host

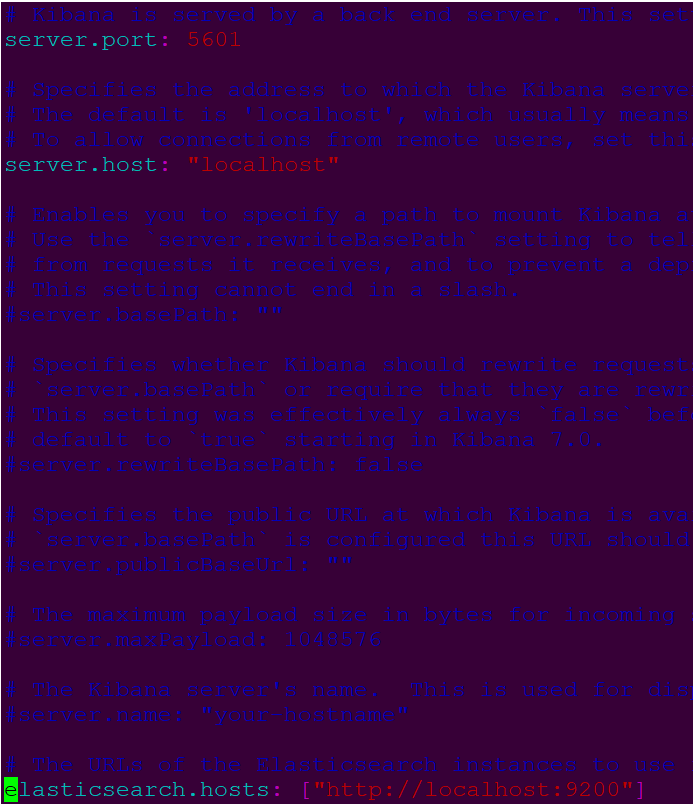
Kibana works on Port 5061 by default

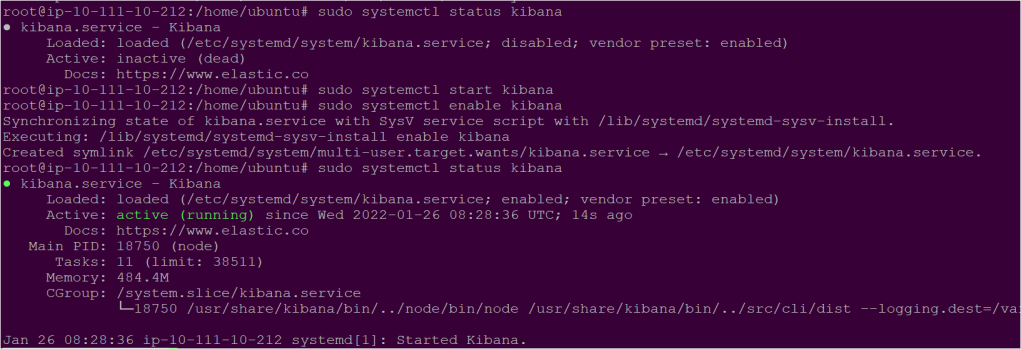
  • Once the configuration file is updated, start and enable the Kibana service that you recently installed.
sudo systemctl start kibana
sudo systemctl enable kibana
starting and enabling the Kibana service

Viewing Kibana Dashboard on Ubuntu Machine

Great, now you have elasticsearch running on Port 9200 and Kibana running on Port 5601. Still, to view the Kibana dashboard on the Ubuntu machine, you need to use the Apache server as your proxy server, allowing the Kibana Dashboard to be viewed on Port 80.

Let’s configure apache to run as a proxy server.

  • Create the configuration file named domain.conf in /etc/apache2/sites-available directory and copy/paste the below configuration file.
vi /etc/apache2/sites-available/domain.conf
<VirtualHost *:80>
    ServerName localhost
    ProxyRequests Off
    ProxyPreserveHost On
    ProxyVia Full
    <Proxy *>
        Require all granted
    </Proxy>
    ProxyPass / http://127.0.0.1:5601/
    ProxyPassReverse / http://127.0.0.1:5601/
</VirtualHost>
  • After changing the Apache configuration file run the below commands so that apache works as proxy server.
sudo a2dissite 000-default
sudo a2enmod proxy proxy_http rewrite headers expires
sudo a2ensite domain.conf
sudo service apache2 restart

Verify the Kibana Dashboard

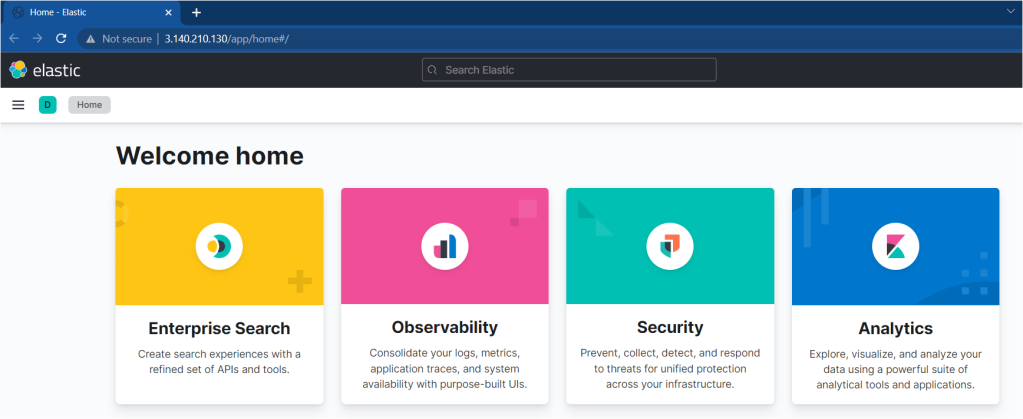
Earlier in the previous section, you installed kibana and configured it to run behind the apache server. Let’s verify by viewing the Kibana dashboard by navigating to the IP address of the server followed by Port 80.

As you can see below, the Kibana dashboard loads successfully.

Kibana dashboard loads successfully.

How to Install Logstash

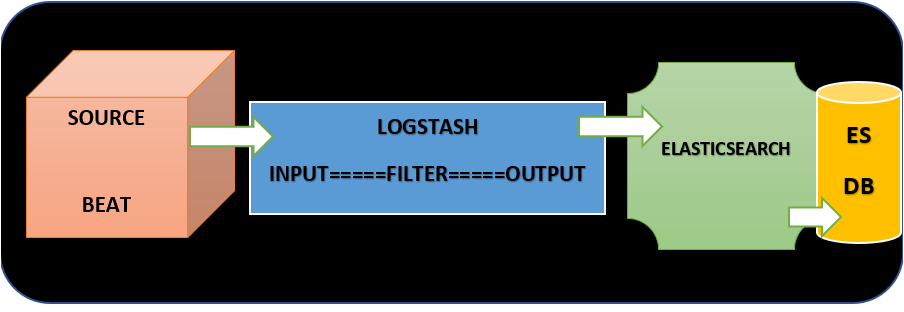
Logstash is a lightweight, open-source, server-side data processing pipeline that allows you to collect data from various sources, transform it on the fly, and send it to your desired destination. Logstash is a tool that collects data from multiple sources, stores it in Elasticsearch, and is parsed by Kibana.

With that, let’s install the third component used in Elastic Stack. Let’s install Logstash on an Ubuntu machine.

  • Install Logstash by running the following command.
sudo apt-get install logstash
Installing Logstash
Installing Logstash
  • Now start and enable the Logstash by running the systemctl commands.
sudo systemctl start logstash
sudo systemctl enable logstash
Starting and Enabling the Logstash
  • Finally verify the Logstash by running the below command.
sudo systemctl status logstash
Verifying the Logstash

Configuring Logstash with Filebeat

Awesome, now you have Logstash installed. You will configure beats in the Logstash; although beats can send the data directly to the Elasticsearch database, it is good to use Logstash to process the data. Let’s configure beats in the Logstash with the below steps.

  • Create a file named logstash.conf and copy/paste the below data that allows you to set up Filebeat input .
# Specify the incoming logs from the beats in Logstash over Port 5044

input {
  beats {
    port => 5044
  }
}

# By filter syslog messages are sent to Elasticsearch

filter {
  if [type] == "syslog" {
    grok {
      match => { "message" => "%{SYSLOGTIMESTAMP:syslog_timestamp} %{SYSLOGHOST:syslog_hostname} %{DATA:syslog_program}(?:\[%{POSINT:syslog_pid}\])?: %{GREEDYDATA:syslog_message}" }
      add_field => [ "received_at", "%{@timestamp}" ]
      add_field => [ "received_from", "%{host}" ]
    }
    date {
      match => [ "syslog_timestamp", "MMM  d HH:mm:ss", "MMM dd HH:mm:ss" ]
    }
  }
}

# Specify output will push logstash logs to an Elastisearch instance

output {
  elasticsearch { hosts => ["localhost:9200"]
    hosts => "localhost:9200"
    manage_template => false
    index => "%{[@metadata][beat]}-%{+YYYY.MM.dd}"
    document_type => "%{[@metadata][type]}"
  }
}

  • Now test your Logstash configuration with below command. If you see Configuration OK message then the setup is properly done.
sudo -u logstash /usr/share/logstash/bin/logstash --path.settings /etc/logstash -t
test your Logstash configuration
Test your Logstash configuration
  • Finally start and enable Logstash with below command.
sudo systemctl start logstash
sudo systemctl enable logstash

Installing and Configuring Filebeat

The Elastic Stack uses lightweight data shippers called beats ( such as Filebeat, Metricbeat ) to collect data from various sources and transport them to Logstash or Elasticsearch. You will learn to install and configure Filebeat on an Ubuntu machine that will be used to push data in Logstash and further to Kibana.

  • Install Filebeat on ubuntu machine using following commnads.
sudo apt install filebeat
Installing the Filebeat
  • Next, edit the Filebeat configuration file so that filebeat is able to connect to Logstash. Uncomment the output.logstash and hosts: [“localhost:5044”] and comment the output.elasticsearch: and hosts: [“localhost:9200”].
vi /etc/filebeat/filebeat.yml
Uncomment the output.logstash and hosts: ["localhost:5044"]
Uncomment the output.logstash and hosts: [“localhost:5044”]
comment the output.elasticsearch: and hosts: ["localhost:9200"]
comment the output.elasticsearch: and hosts: [“localhost:9200”]
  • Next enable the filebeat with below command.
sudo filebeat modules enable system
sudo filebeat setup --pipelines --modules system
Enabling the filebeat
  • Now, Load the index template from the Filebeat into Logstash by running the below command. Index template are collection of documents that have similar characteristics.
sudo filebeat setup --template -E output.logstash.enabled=false -E 'output.elasticsearch.hosts=["localhost:9200"]'
Load the index template from the Filebeat into Logstash
  • Also run the below command so that Logstash can further push to Elasticsearch.
sudo filebeat setup -e -E output.logstash.enabled=false -E output.elasticsearch.hosts=['localhost:9200'] -E setup.kibana.host=localhost:5601
Logstash can further push to Elasticsearch
  • Now you can start and enable Filebeat.
sudo systemctl start filebeat
sudo systemctl enable filebeat
start and enable Filebeat

Installing and Configuring Metricbeat

Previously you learned to install and configure Filebeat, but this time you will learn to install and configure Metricbeat. Metricbeat is a lightweight shipper that you can install on your servers to periodically collect metrics from the operating system and from services running on the server.

  • To download and install Metricbeat, open a terminal window and use the commands that work with your system:
curl -L -O https://artifacts.elastic.co/downloads/beats/metricbeat/metricbeat-7.16.3-amd64.deb
sudo dpkg -i metricbeat-7.16.3-amd64.deb
  • From the Metricbeat install directory, enable the system module:
sudo metricbeat modules enable system
  • Set up the initial environment for Metricbeat and Start Metricbeat by running the following commands.
sudo metricbeat setup -e
sudo service metricbeat start

Verifying the ELK Stack in the Kibana Dashboard

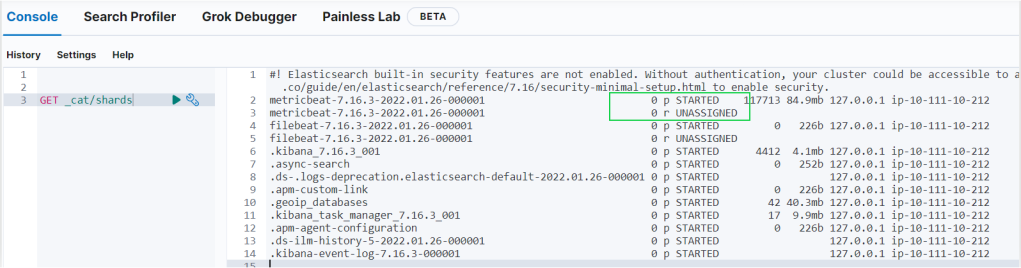
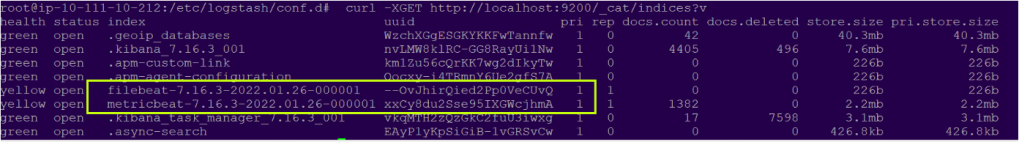
Now that you have your ELK Elastic Stack set up completely. Filebeat and Metricbeat will begin pushing the Syslog and authorization logs to Logstash, then load that data into Elasticsearch. To verify if Elasticsearch is receiving the data, query the index with the below command.

 curl -XGET http://localhost:9200/_cat/indices?v
  • As you can see below the request is successful, that means the data that was pushed by filebeat is successfully stored in elasticsearch.
Filebeat and Metricbeat pushing the data in ELasticsearch
Kibana Dashboard with beats configured
Logs from Metricbeat in Kibana Dashboard.

Join 64 other subscribers

Conclusion

In this tutorial, you learned how to install ELK Stack, including installing components, i.e., Elasticsearch, Logstash, Kibana Dashboard, Filebeat, and Metricbeat on the Ubuntu machine.

Now that you have a strong understanding of ELK Stack and all the components, which application do you plan to monitor next?

Learn ELK Stack from Scratch: Elasticsearch, Logstash, Kibana dashboard, and AWS Elasticsearch

If you want to analyze data for your website or applications, consider learning ELK Stack or Elastic Stack that contains Elasticsearch, logstash, and Kibana dashboard.

Elasticsearch is a powerful analytics search engine that allows you to store, index, and search the documents of all types of data in real-time. But if you need your search engine to automatically scale, load-balanced then AWS Elasticsearch (Amazon OpenSearch) is for you.

In this tutorial, you will learn what is Elastic Stack, Elasticsearch, Logstash, kibana dashboard, and finally AWS Elasticsearch from Scratch, and believe me, this tutorial will be helpful for you.

Let’s get into it.

Related: Install ELK Stack on Ubuntu: Elasticsearch, Logstash, and Kibana Dashboard.

Join 64 other subscribers

Table of Content

  1. What is ELK Stack or Elastic Stack?
  2. What is Elasticsearch ?
  3. QuickStart Kibana Dashboard
  4. What is Logstash?
  5. Features of Logstash
  6. What is AWS Elasticsearch or Amazon OpenSearch Service?
  7. Creating the Amazon Elasticsearch Service domain or OpenSearch Service domain
  8. Uploading data in AWS Elasticsearch
  9. Search documents in Kibana Dashboard
  10. Conclusion

What is ELK Stack or Elastic Stack?

The ELK stack or Elastic Stack is used to describe a stack that contains: Elasticsearch, Logstash, and Kibana. The ELK stack allows you to aggregate logs from all your systems and applications, analyze these logs, and create visualizations for application and infrastructure monitoring, faster troubleshooting, security analytics, and more.

  • E = Elasticsearch: Elasticsearch is a distributed search and analytics engine built on Apache Lucene
  • L = Logstash: Logstash is an open-source data ingestion tool that allows you to collect data from a various sources and then transforms it and send it to your desired destination
  • K = Kibana: Kibana is a data visualization and exploration tool for reviewing logs and events.
ELK Stack architecture

What is Elasticsearch ?

Elasticsearch is an analytics and full-text search engine built on the Apache Lucene search engine library where the indexing, search, and analysis operations occur. Elasticsearch is a powerful analytics search engine that allows you to store, index, and search the documents of all types of data in real-time.

Even if you have structured or unstructured text numerical data, Elasticsearch can efficiently store and index it in a way that supports fast searches. Some of the features of Elasticsearch are:

  • Provides the search box on the website, web page or on applications.
  • Stores and analyze the data and metrics.
  • Logstash and Beats helps with collecting, aggregating the data and storing it in Elasticsearch.
  • Elasticsearch is used in the machine learning.
  • Elasticsearch stores complex data structures that have been serialized as JSON documents.
  • If you have multiple Elasticsearch nodes in Elasticsearch cluster then documents are distributed across the cluster and can be accessed immediately from any node.
  • Elasticsearch also has the ability to be schema-less, which means that documents can be indexed without explicitly specifying how to handle each of the different fields.
  • The Elasticsearch REST APIs support structured queries, full text queries, and complex queries that combine the two.You can access all of these search capabilities using Elasticsearch’s comprehensive JSON-style query language (Query DSL).
  • Elasticsearch index can be thought of as an optimized collection of documents and each document is a collection of fields, which are the key-value pairs that contain your data.
  • Elasticsearch index is really just a logical grouping of one or more physical shards, where each shard is actually a self-contained index.
  • There are two types of shards: primaries and replicas. Each document in an index belongs to one primary shard. The number of primary shards in an index is fixed at the time that an index is created, but the number of replica shards can be changed at any time.
  • Sharding splits index or indices into smaller pieces. It is used so that more number of documents can be stored at index level, easier to fit large indices into nodes, improve query throughput. By default index have one shard and you can add more shards.
Elasticsearch Cluster

Elasticsearch provides REST API for managing your cluster and indexing and searching your data. For testing purposes, you can easily submit requests directly from the command line or through the Kibana dashboard by running the GET request in the Kibana console under dev tools, as shown below.

<IP-address-of-elasticsearch>/app/dev_tools#/console
Kibana console with Dev tools
  • You can find the Elasticsearch cluster health by running the below command where _cluster is API and health is the command.
GET _cluster/health
Checking the health of the Elasticsearch cluster
  • To check the Elasticsearch node details using below command.
GET _cat/nodes?v
Checking the health of the elasticsearch node
  • To check the Elasticsearch indices configured, run the below command. You will notice kibana is also listed as indices because kibana data is also stored in elasticsearch.
GET _cat/indices
Checking the Elasticsearch indices on the elasticsearch cluster
  • To check the Primary and replica shards from a kibana console run the below request.
GET _cat/shards
Checking all the primary shards and replica shards in elasticsearch cluster
Checking all the primary shards and replica shards in the elasticsearch cluster

QuickStart Kibana Dashboard

Kibana allows you to search the documents, observe the data and analyze the data, visualize in charts, maps, graphs, and more for the Elastic Stack in the form of a dashboard. Your data can be structured or unstructured text, numerical data, time-series data, geospatial data, logs, metrics, security events.

Kibana also manages your data, monitor the health of your Elastic Stack cluster, and control which users have access to the Kibana Dashboard.

Kibana also allows you to upload the data into the ELK stack by uploading your file and optionally importing the data into an Elasticsearch index. Let’s learn how to import the data in the kibana dashboard.

  • Create a file named shanky.txt and copy/paste the below content.
[    6.487046] kernel: emc: device handler registered
[    6.489024] kernel: rdac: device handler registered
[    6.596669] kernel: loop0: detected capacity change from 0 to 51152
[    6.620482] kernel: loop1: detected capacity change from 0 to 113640
[    6.636498] kernel: loop2: detected capacity change from 0 to 137712
[    6.668493] kernel: loop3: detected capacity change from 0 to 126632
[    6.696335] kernel: loop4: detected capacity change from 0 to 86368
[    6.960766] kernel: audit: type=1400 audit(1643177832.640:2): apparmor="STATUS" operation="profile_load" profile="unconfined" name="lsb_release" pid=394 comm="apparmor_parser"
[    6.965983] kernel: audit: type=1400 audit(1643177832.644:3): apparmor="STATUS" operation="profile_load" profile="unconfined" name="nvidia_modprobe" pid=396 comm="apparmor_parser"
  • Once the file is uploaded successfully you will see the details of all code that you uploaded.
Data uploaded in the kibana
Details of the data uploaded in the kibana
  • Next create the elasticsearch index and click on import.
Creating the elasticsearch index on Elasticsearch cluster
Creating the elasticsearch index on the Elasticsearch cluster
  • After import is successful you will see the status of your elasticsearch index as below.
Status of file upload in kibana
  • Next, click View index in Discover as shown in the the previous image. Now you should be able to see the logs within elasticsearch index (shankyindex).
Checking the logs in kibana with newly created index

Kibana allows you to perform the below actions such as:

  • Refresh, flush, and clear the cache of your indices or index.
  • Define the lifecycle of an index as it ages.
  • Define a policy for taking snapshots of your Elasticsearch cluster.
  • Roll up data from one or more indices into a new, compact index.
  • Replicate indices on a remote cluster and copy them to a local cluster.
  • Alerting allows you to detect conditions in different Kibana apps and trigger actions when those conditions are met.

What is Logstash?

Logstash allows you to collect the data with real-time pipelining capabilities. Logstash allows you to collect data from various sources beats and push it to the elasticsearch cluster. With Logstash, any type of event is transformed using an array of input, filter, and output plugins, further simplifying the ingestion process.

Working of Logstash
Working of Logstash

Features of Logstash

Now that you have a basic idea about Logstash, let’s look at some of the benefits of Logstash, such as:

  • Logstash hndle all types of logging data and easily ingest web logs like Apache, and application logs like log4j for Java.
  • Logstash captures other log formats like syslog, networking and firewall logs.
  • One of the main benefits of Logstash is to securely ingest logs with Filebeat.

What is AWS Elasticsearch or Amazon OpenSearch Service??

Amazon Elasticsearch Service or OpenSearch is a managed service that deploys and scales the Elasticsearch clusters in the cloud. Elasticsearch is an open-source analytical and search engine that performs real-time application monitoring and log analytics.

Amazon Elasticsearch service provisions all resources for Elasticsearch clusters and launches it. It also replaces the failed Elasticsearch nodes in the cluster automatically. Let’s look at some of the key features of the Amazon Elasticsearch Service.

  • AWS Elasticsearch or Amazon OpenSearch can scale up to 3 PB of attached storage and works with various instance types.
  • AWS Elasticsearch or Amazon OpenSearch easily integrates with other services such as IAM for security, VPC, AWS S3 for loading data, AWS Cloud Watch for monitoring and AWS SNS for alerts notifications.
  • With Opensearch you can search any field, even partially matches as compared to dynamodb where you can search any field even partially matched fields.
  • Ingestion can happen from kinesis data firehose, AWS IOT and CloudWatch logs.

OpenSearch Integration with other AWS services.

Creating the Amazon Elasticsearch Service domain or OpenSearch Service domain

Now that you have a basic idea about the Amazon Elasticsearch Service domain or OpenSearch Service let’s create the Amazon Elasticsearch Service domain or OpenSearch Service domain using the Amazon Management console.

  • While in the Console, click on the search bar at the top, search for ‘Elasticsearch’, and click on the Elasticsearch menu item.

Now Elasticsearch service has been replaced with Opensearch service.

Searching for Elasticsearch service
  • Creating a Amazon Elasticsearch domain is same as that of Elasticsearch cluster that means domains are clusters with the settings, instance types, instance counts, and storage resources that you specify. Click on create a new domain.
Creating an Amazon Elasticsearch domain
  • Next, select the deployment type as Development and testing.
Choosing the deployment type.

Next, select the below settings as defined below:

  • For Configure domain provide the Elasticsearch domain name as “firstdomain”. A domain is the collection of resources needed to run Elasticsearch. The domain name will be part of your domain endpoint.
  • For Data nodes, choose the t3.small.elasticsearch and ignore rest of the settings and click on NEXT.
  • For Network configuration, choose Public access.
  • For Fine-grained access control, choose Create master user and provide username as user and password as Admin@123. Fine-grained access control keeps your data safe.
  • For Domain access policy, choose Allow open access to the domain. Access policies control whether a request is accepted or rejected when it reaches the Amazon Elasticsearch Service domain.
  • Further keep clicking on NEXT button and create the domain which takes few minutes for Domain to get Launched.
Viewing the Elasticsearch domain or Elasticcluster endpoint
  • After successful creation of Elasticsearch domain. Click on the firstdomain Elasticsearch domain.
firstdomain Elasticsearch domain
Elasticsearch domain (first domain)

Uploading data in AWS Elasticsearch

You can load streaming data into your Amazon Elasticsearch Service (Amazon ES) domain from many different sources like Amazon Kinesis Data Firehose, Amazon Cloud Watch Logs, Amazon S3, Amazon Kinesis Data Streams, Amazon DynamoDB, AWS Lambda functions as event handlers.

  • In this tutorial you will use a sample data to upload the data. To upload the sample data go to the Elasticsearch domain URL using the username user and password Admin@123 and then click on Add data.
Adding data in Elasticsearch
  • Now use sample data and add e-commerce orders.
 sample data to add e-commerce orders in Elasticsearch cluster
sample data to add e-commerce orders in Elasticsearch cluster

Search documents in Kibana Dashboard

Kibana is a popular open-source visualization tool that works with the AWS Elasticsearch service. It provides an interface to monitor and search the indexes. Let’s use Kibana to search the sample data you just uploaded in AWS ES.

  • Now in the Elasticsearch domain URL itself, Click on Discover option on the left side to search the data.
Click on the Discover option
Click on the Discover option.
  • Now you will notice that Kibana has the data that got uploaded. You can modify the timelines and many other fields accordingly.
Viewing the data in Kibana dashboard
Viewing the data in the Kibana dashboard

Join 64 other subscribers

Kibana provided the data when we searched in the dashboard using the sample data you uploaded.

Conclusion

In this tutorial, you learned what Elastic Stack, Elasticsearch, Logstash, kibana dashboard, and AWS Elasticsearch from Scratch using Amazon Management console. Also, you learned t how to upload the sample data in AWS ES.

Now that you have a strong understanding of ELK Stack, Elasticsearch, kibana, and AWS Elasticsearch, which site are you planning to monitor using ELK Stack and components?

The Ultimate Guide: Getting Started with Jenkins Pipeline

Are you struggling to automate the application deployment? Why not use Jenkins and Jenkins Pipeline to automate all the deployments more easily and effectively.

With Jenkins Pipeline, the deployment process is earlier and gives you more features to incorporate while deploying or managing the infrastructure.

In this tutorial, you will learn what is Jenkins Pipeline in depth. Let’s get started.

Join 64 other subscribers

Table of Content

  1. What is CI/CD ( Continuous Integration and Continuous deployments)?
  2. What is Jenkins Pipeline?
  3. How to create a basic Jenkins Pipeline
  4. Handling Parameters in Jenkins Pipeline
  5. How to work with Input Parameters
  6. Conclusion

Prerequisites

What is CI/CD ( Continuous Integration and Continuous deployments)?

CI/CD products are delivered to clients ingeniously and effectively using different automated stages. CI/CD saves tons of time for both developer and operations team, and there are very few chances of human errors. CI/CD stands for continuous integration and continuous deployments. It automates everything starting from integrating to deployments.

Continuous Integration and Continuous deployments

What is Continuous Integration?

Continuous integration is primarily used by developers so that developers’ code is built, tested, and then pushed to a shared repository whenever there is a change in code.

For every code push to the repository, you can create a set of scripts to build and test your application automatically. These scripts help decrease the chances that you introduce errors in your application.

This practice is known as Continuous Integration. Each change submitted to an application, even to development branches, is built and tested automatically and continuously.

What is Continuous Delivery?

Continuous delivery is a step beyond continuous integration. With Continuous Delivery, the application is not only continuously built and tested each time the code is pushed but the application is also deployed continuously. However, with continuous delivery, you trigger the deployments manually.

Continuous delivery checks the code automatically, but it requires human intervention to deploy the changes.

What is Continuous Deployment

Continuous deployment is again a step beyond continuous integration and the only difference between deployment and delivery is: deployment automatically takes the code from a shared repository and deploys the changes to environments such as Production where customers can see those changes.

This is the final stage of the CI/CD pipeline. With Continous Deployment, it hardly takes a minute to deploy the code to the environments. It depends on heavy pre-automation testing.

Examples of CI/CD :

  • Spinnaker and Screwdriver built platform for CD
  • GitLab, Bamboo, CircleCI, Travis CI and GoCD are built platform for CI/CD.

What is Jenkins Pipeline?

Jenkins Pipeline uses a group of plugins that help deliver a complete continuous delivery pipeline starting from building the code till deployment of the software right up to the customer.

Jenkins Pipeline plugin is automatically installed while installing the Jenkins with suggested plugins and allows you to write complex operations and code deployment as code using DSL language ( Domain-specific language). Some of the benefits of the Jenkins pipeline are:

Jenkinsfile ( declarative vs scripted pipeline)

Jenkins pipeline is written in code with Jenkinsfile that is easier, gives more ability to review, and supports various extensions & plugins. Also if Jenkins stops you can still continue to write or update the Jenkinsfile. With code capabilities you can allow waiting, approvals, stop, and many other functionalities. Jenkinsfile follows two syntaxes:

  • Declarative Pipeline: This is newer and writing code with this is much easier.
  • Scripted Pipeline: This is older and writing code with this is a little complicated.

Scripted pipeline syntax

Jenkins provides you an easier way to generate the Scripted pipeline syntax by navigating to the below URL.

http://Jenkins-server:8080/pipeline-syntax/
Scripted pipeline syntax

Declarative Pipeline syntax

Jenkins also provides you a way to generate the Declarative pipeline syntax by navigating to the below URL.

http://Jenkins-server:8080/directive-generator/
Declarative Pipeline syntax

Jenkins variables

Let’s quickly look at the Jenkins Pipeline environmental variables that are supported.

  • BUILD_NUMBER: Displays the build number
  • BUILD_TAG: Displays the tag which is jenkins-${JOB_NAME}-${BUILD_NUMBER}
  • BUILD_URL: Displays the URL of the result of Build
  • JAVA_HOME: Path of Java home
  • NODE_NAME: It specifics the name of the node. For example, set it to master is for Jenkins controller
  • JOB_NAME: Name of the Job

You can set the environmental variables dynamically in the Jenkins pipeline as well.

    environment {
        AWS_ACCESS_KEY_ID     = credentials('jenkins-aws-secret-key-id')
        AWS_SECRET_ACCESS_KEY = credentials('jenkins-aws-secret-access-key')
        MY_KUBECONFIG = credentials('my-kubeconfig')
   }

Jenkinsfile example

Previously you learned about Jenkinsfile syntax and variables that can be included in Jenkinfile. In this section lets learn by seeing a basic example declarative pipeline. 

Below are all the arguments that are used within the Jenkinsfile and their function is specified below.

  • agent: Agent allows Jenkins to allocate an executor or a node. For example Jenkins slave
  • Stages: It include multiple tasks which Pipeline needs to perform. It can have a single task as well.
  • Stage: Stage is one single task under stages.
  • steps: These are steps which needs to be executed in every stage.
  • sh: sh is one of the step which executes shell command.
pipeline {
   agent any 
    stages {
        stage('Testing the Jenkins Version') {
            steps {
                echo 'Hello, Jenkins'
                sh 'service jenkins status'
               //  sh("kubectl --kubeconfig $MY_KUBECONFIG get pods")
            }
        }
    }
}

Jenkins Job example to run Jenkins Pipeline

In this section, lets quickly learn how you can execute jenkins job with Jenkinsfile and Jenkins Pipeline. Lets create Jenkins job quickly.

  • Navigate to Jenkins URL and click on New Item.
Click on new item in Jenkins Job
  • Next, choose Pipeline as the type of Jenkins job from the option as shown below, provide the of Jenkins Job as pipeline-demo and click OK.
Choosing the Pipeline and naming the Jenkins Job
  • Now in the Jenkins job provide the description as my demo pipeline.
  • Further in the script copy/paste the below code.
pipeline {
   agent any 
    stages {
        stage('Testing the Jenkins Version') {
            steps {
                echo 'Hello, Jenkins'
                sh 'service jenkins status'
            }
        }
    }
}
  • Finally click on save & click on Build Now button.
Running the Jenkins Job to run Jenkins Pipeline

Now that you have successfully run your first Jenkins Job using Jenkins Pipeline. lets verify the code execution from console output of the Job and to do that click on the build number from build history.

Build History of Jenkins Job
Verifying the Jenkins Job using console output

Handling Parameters in Jenkins Pipeline

If you wish to use Build with Parameters , so those parameters are accessible using params keyword in pipeline.

Lets see a quick example. In below code we have Profile as a parameter and it can be accessed as ${params.Profile} .Lets paste the code in pipeline script as we did earlier

pipeline {
  agent any
  parameters {
    string(name: 'Profile', defaultValue: 'devops-engineer', description: 'I am devops guy') 
}
 stages {
    stage('Testing DEVOPS') {
       steps {
          echo "${params.Profile} is a cloud profile"
       }
     }
   }
}
  • Lets build the Jenkins pipeline now.
  • Next verify the console output
  • Similarly we can use different parameters such
pipeline {
    agent any
    parameters {
        string(name: 'PERSON', defaultValue: 'AutomateInfra', description: 'PERSON')
        text(name: 'BIOGRAPHY', defaultValue: '', description: 'BIOGRAPHY')
        booleanParam(name: 'TOGGLE', defaultValue: true, description: 'TOGGLE')
        choice(name: 'CHOICE', choices: ['One', 'Two', 'Three'], description: 'CHOICE')
        password(name: 'PASSWORD', defaultValue: 'SECRET', description: 'PASSWORD')
    }
    stages {
        stage('All-Parameters') {
            steps {
                echo "I am ${params.PERSON}"
                echo "Biography: ${params.BIOGRAPHY}"
                echo "Toggle: ${params.TOGGLE}"
                echo "Choice: ${params.CHOICE}"
                echo "Password: ${params.PASSWORD}"
            }
        }
    }
}

How to work with Input Parameters

Input parameter allows you to provide an input using a input step. Unless input is provided the pipeline will be paused. Lets see a quick example in which Jenkins job will prompt for “should we continue” message. Unless we approve it will remain as it is else finally it will abort.

pipeline {
    agent any
    stages {
        stage('Testing input condition') {
            input {
                message "Should we continue?"
                ok "Yes, we should."
                submitter "automateinfra"
                parameters {
                    string(name: 'PERSON', defaultValue: 'Automate', description: 'Person')
                }
            }
            steps {
                echo "Hello, ${PERSON}, nice to meet you."
            }
        }
    }
}
  • Lets paste the content in Jenkins pipeline script and click on build now.
  • Let us verify by clicking on build Now

Conclusion

In this tutorial we learnt what is CI/CD and CI/CD open source tool Jenkins. We covered how to write pipeline and syntax of Jenkins pipeline using its language known as DSL ( domain specific language ) . Also we learnt in depth of Jenkins pipeline and created basic Jenkins pipeline and executed it.

Hope this tutorial will help you a kick start to how to work with Jenkins pipeline and execute them. If you like this please share it.

Brilliant Guide to Check all possible ways to view Disk usage on Ubuntu Machine

Monitoring of application or system disk utilization has always remained a top most and crucial responsibility of any IT engineer. In the IT world with various software’s , automation and tools it is very important to keep a track of disk utilization regularly.

Having said that, In this tutorial we will show you best commands and tools to work with your disk utilization. Please follow me along to read and see these commands and their usage.

Table of content

  1. Check Disk Space using disk free or disk filesystems command ( df )
  2. Check Disk Space using disk usage command ( du )
  3. Check Disk Usage using ls command
  4. Check Disk Usage using pydf command
  5. Check Disk Usage using Ncdu command( Ncurses Disk Usage )
  6. Check Disk Usage using duc command
  7. conclusion

Check Disk Space using disk free or disk filesystems command (df)

It stands for disk free. This command provides us information about the available space and used space on a file system. There are multiple parameters which can be passed along with this utility to provide additional outputs. Lets look at some of the commands from this utility.

  • To see all disk space available on all the mounted file systems on ubuntu machine.
df
  • To see all disk space available on all the mounted file systems on ubuntu machine in human readable format.
    • You will notice a difference in this command output and a previous. The difference is instead of 1k-blocks you will see size which is human readable.
df -h
  • To check the disk usage along with type of filesystem
df -T
  • To check disk usage of particular Filesystem
df /dev/xvda1
  • To check disk usage of multiple directories.
df -h  /opt /var /etc /lib
  • To check only Percent of used disk space
df -h --output=source,pcent
  • To check data usage based on filesystem wise
df -h -t ext4

Check Disk Space using disk usage command ( du )

du command provides disk usage information. This command provides file and directories space utilization. Lets see some of the example .

  • To check disk usage of directory
du /lib # Here we are taking lib directory
  • To check disk usage of directory with different block size type .
    • M for MB
    • G for GB
    • T for TB
du -BM /var
  • To check disk usage according to the size
    • Here s represents summarize
    • Here k represents size in KB , you can use M, G or T and so on
    • Here sort represents sort
    • Here n represents in numerical order
    • Here r represents in reverse order
du -sk /opt/* | sort -nr

Check Disk Usage using ls command

ls command is used of listing of files but also provides information about disk utilized by directories and files. Lets see some of these command.

  • To list the files in human readable format.
ls -lh
  • To list the file in descending order of size of files.
ls -ls

Check Disk Usage using pydf command

pydf is a python based command-line tool which is used to display disk usage with different colors. Lets dive into command now.

  • To check the disk usage with pydf
pydf -h 

Check Disk Usage using Ncdu command (Ncurses Disk Usage)

Ncdu is a disk utility for Unix systems. This command is text-based user interface under the [n]curses programming library.Let us see a command from Ncdu

ncdu

Check Disk Usage using duc command

Duc is a  command line utility which queries the disk usage database and also create, maintain and the database.

  • Before we run a command using duc be sure to install duc package.
sudo apt install duc
  • duc is successfully installed , now lets now run a command
duc index /usr
  • To list the disk usage using duc command with user interface
duc ui /usr

Conclusion

There are various ways to identify and view disk usage in Linux or ubuntu operating system. In this tutorial we learnt and showed best commands and disk utilities to work with . Now are you are ready to troubleshoot disk usage issues or work with your files or application and identify the disk utilization.

Hope this tutorial gave you in depth understanding and best commands to work with disk usage . Hoping you never face any disk issues in your organization. Please share if you like.

How to build docker images , containers and docker services with Terraform using docker provider.

Docker has been a vital and very important tool for deploying your web applications securely and because of light weighted technology and they way it works has captured the market very well. Although some of the steps are manual but after deployment docker make things look very simple.

But can we automate even before the deployment takes place? So here comes terraform into play which is a infrastructure as a code tool which automate docker related work such as creation of images, containers and service with few commands.

In this tutorial we will see what is docker , terraform and how can we use docker provider in terraform to automate docker images and containers.

Table of content

  1. What is Docker?
  2. What is Terraform?
  3. How to Install terraform on ubuntu machine.
  4. What is Docker provider?
  5. Create Docker Image, containers and docker service using docker provider on AWS using terraform
  6. Conclusion

What is docker ?

Docker is an open source tool for developing , shipping and running applications. It has ability to run applications in loosely isolated environment using containers. Docker is an application which helps in management of containers in a very smooth and effective way. In containers you can isolate your applications. Docker is quite similar to virtual machine but it is light weighted and can be ported easily.

Containers are light weighted as they are independent of hypervisors load and configuration. They directly connect with machines ie. hosts kernel.

Prerequisites

  • Ubuntu machine preferably 18.04 version + , if you don’t have any machine you can create a ec2 instance on AWS account
  • Recommended to have 4GB RAM
  • At least 5GB of drive space
  • Ubuntu machine should have IAM role attached with full access of ec2 instance or it is always great to have administrator permissions to work with terraform demo.

You may incur a small charge for creating an EC2 instance on Amazon Managed Web Service.

What is Terraform?

Terraform is a tool for building , versioning and changing the infrastructure. Terraform is Written in GO Language and the syntax language of configuration files is hcl which stands for HashiCorp configuration language which is much easier than yaml or json.

Terraform has been in use for quite a while now . I would say its an amazing tool to build , change the infrastructure in very effective and simpler way. It’s used with variety of cloud provider such as Amazon AWS, Oracle, Microsoft Azure , Google cloud and many more. I hope you would love to learn it and utilize it.

How to Install Terraform on Ubuntu 18.04 LTS

  • Update your already existing system packages.
sudo apt update
  • Download the latest version of terraform in opt directory
wget https://releases.hashicorp.com/terraform/0.13.0/terraform_0.13.0_linux_amd64.zip
  • Install zip package which will be required to unzip
sudo apt-get install zip -y
  • unzip the Terraform download zip file
unzip terraform*.zip
  • Move the executable to executable directory
sudo mv terraform /usr/local/bin
  • Verify the terraform by checking terraform command and version of terraform
terraform               # To check if terraform is installed 

terraform -version      # To check the terraform version  
  • This confirms that terraform has been successfully installed on ubuntu 18.04 machine.

What is Docker provider in terraform?

Docker provider helps to connect with docker images and docker containers using docker API. So in case of terraform , we would need to configure docker provider so that terraform can work with docker images and containers.

There are different ways in which docker provider can be configured. Lets see some of them now.

  • Using docker host’s hostname
provider "docker" {
  host = "tcp://localhost:2376/"
}
  • Using dockers IP address
provider "docker" {
  host = "tcp://127.0.0.1:2376/"
}
  • In case your docker host is remote machine
provider "docker" {
  host = "ssh://user@remote-host:22"
}
  • Using docker socket

unix:///var/run/docker.sock is a Unix socket the docker daemon listens on. Using this Unix socket you can connect with multiple docker images and containers.

This Unix socket is also used when containers need to communicate with docker daemon such as during the mount binding.

provider "docker" {                             
host = "unix:///var/run/docker.sock"
    }

Create a Docker Image, container and service using docker provider on AWS using terraform

Let us first understand terraform configuration files before we start creating files for our demo.

  • main.tf : This file contains actual terraform code to create service or any particular resource
  • vars.tf : This file is used to define variable types and optionally set the values.
  • output.tf: This file contains the output of resource we wish to store. The output are displayed
  • terraform.tfvars: This file contains the actual values of variables which we created in vars.tf
  • provider.tf: This file is very important as we provide information to terraform regarding on which cloud provider it needs to execute the code

Now, In below demo we will create docker image , container , services using docker provider. Now Lets configure terraform files which are needed for this demo. In this demo we only need one file that is main.tf to start with.

main.tf

provider "docker" {                                 # Create a Docker Provider
host = "unix:///var/run/docker.sock"
 }

resource "docker_image" "ubuntu" {                  # Create a Docker Image
    name = "ubuntu:latest"
}

resource "docker_container" "my_container" {        # Creates a Docker Container
  image = docker_image.ubuntu.latest         # Using same image which we created earlier
  name = "my_container"
}

resource "docker_service" "my_service" {            # Create a Docker Service
  name = "myservice"
  task_spec {
   container_spec {
     image = docker_image.ubuntu.latest     # Using same image which we created eearlier
    }
   }
  endpoint_spec {
    ports {
     target_port = "8080"
       }
    }
}
  • Now your files and code are ready for execution . Initialize the terraform
terraform init
  • Terraform initialized successfully ,now its time to run the terraform plan command.
  • Terraform plan is a sort of a blueprint before deployment to confirm if correct resources are being provisioned or deleted.
terraform plan

NOTE:

If you intend to create Docker service on same machine without having multiple nodes please run below command first so that our docker service gets created successfully using terraform

docker swarm init
  • After verification , now its time to actually deploy the code using apply.
terraform apply
  • Now lets verify all the three components one by one if they are created successfully using terraform with docker provider.
  • Verify docker image
docker images
  • Verify docker containers
docker ps -a
  • Verify docker service
docker service ps 

Conclusion:

In this tutorial we will see what is docker , terraform and how can we use docker provider in terraform to automate docker images and containers.

Hope this tutorial will help you in understanding the terraform and provisioning the docker components using terraform. Please share with your friends if you find it useful.